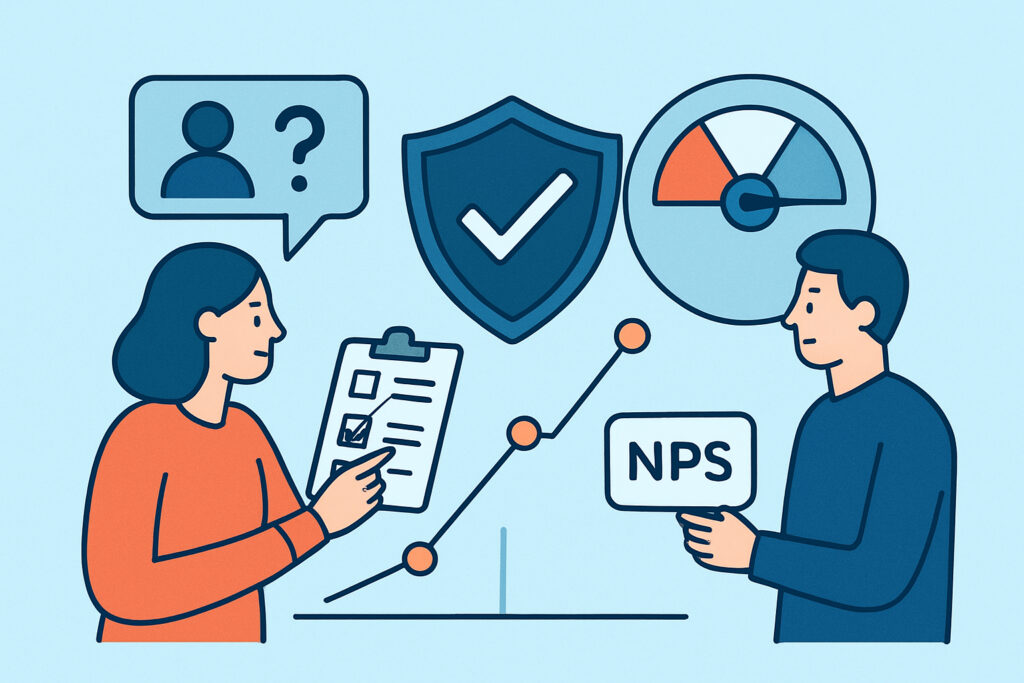
Quantifying brand trust is one of the harder jobs in marketing, because trust is a feeling that only shows up in data indirectly. Brand managers, founders and reputation leads get asked for a single number that tells the board whether customers trust the brand. This article covers how to measure brand trust with three types of data – surveys, Net Promoter Score (NPS) and behavior metrics – and how to combine them so the number actually holds up when someone challenges it.
The short answer: no single metric captures trust. A solid measurement setup uses survey data to see what people say, NPS to see what they would recommend, and behavior data to check whether they act on it.
Why Trust Resists a Single Number
Trust has at least three parts: belief that the brand is competent, belief that it is honest, and belief that it will treat the customer fairly when something goes wrong. A customer can rate product quality highly and still distrust how the company handles billing or personal data.
That is why tracking only star ratings or only NPS gives a skewed picture. Each method picks up one part and misses the rest. The useful question is not “what is our trust score?” but “where is trust strong, where is it weak, and is it changing?”
Survey-Based Trust Measurement
Direct trust surveys are the most explicit method. A typical setup asks 4-6 agreement statements on a 1-7 scale, such as “This brand keeps its promises,” “I believe this company is honest about its pricing,” and “If I had a problem, this company would resolve it fairly.” Tools like Qualtrics, SurveyMonkey and Typeform handle this easily, and a quarterly cadence is enough for most brands.
An experienced insights manager does three things before trusting the results. They fix the wording and keep it unchanged for at least four quarters, since changing one word breaks comparability. They survey a random sample instead of only recent buyers. And they separate customers from non-customers, because trust among prospects often differs sharply from trust among existing buyers.
For benchmarking against the wider market, the Edelman Trust Barometer, published every January since 2001, is useful context. Use it as a backdrop, not as a direct comparison – its methodology targets the general public, not your customer base.
What NPS Tells You About Brand Trust – and What It Doesn’t
NPS was introduced by Fred Reichheld of Bain & Company in a 2003 Harvard Business Review article. Customers answer one question on a 0-10 scale: how likely are they to recommend the brand? Scores of 9-10 are promoters, 7-8 passives, 0-6 detractors. NPS is the percentage of promoters minus the percentage of detractors, giving a range from -100 to +100.
Myth: a high NPS means customers trust you. NPS measures willingness to recommend, which correlates with trust but is not the same thing. Customers recommend brands they find convenient or cheap even when they distrust the company’s data practices. Plenty of low-cost airlines and telecom providers have had loyal recommenders who would not trust them with a complaint.
Sample size matters more than most dashboards admit. With 150-200 responses, NPS can swing 10 points or more between quarters purely from noise. B2B companies with fewer than 100 accounts should report NPS as a range or track individual account movement instead of a headline number.
Cultural response bias is another edge case. Respondents in Japan and parts of Northern Europe tend to avoid the top of the scale, so a +20 NPS there may reflect stronger loyalty than +40 in the United States. Multi-market brands should compare each market against its own history, not against other countries.
Behavior Metrics That Reveal Real Trust
Surveys capture intent. Behavior captures what people actually do when money or personal data is at stake. The strongest behavioral trust signals are:
– Repeat purchase or renewal rate – customers who come back are voting with their wallets.
– Branded search volume in Google Search Console and Google Trends – rising branded queries indicate people seek you out directly.
– Checkout and signup abandonment at the payment or data-entry step, tracked in Google Analytics 4 funnels.
– Review volume and rating trends across Google, Trustpilot and G2, including whether customers voluntarily leave reviews.
– Opt-in rates for optional data sharing, such as marketing consent or account linking.
Abandonment at the payment step is especially telling. If cart-to-checkout conversion is steady but checkout-to-payment drops by 8-12 percentage points after a site redesign, customers likely hesitate to hand over card details. That is a trust problem, not a UX problem.
Building a Composite Trust Index Step by Step
A practical composite index can be built in about a month. First, pick 2-3 metrics from each category – survey, NPS and behavior. Second, collect 12 months of history where possible, so you have a baseline. Third, convert each metric to a 0-100 scale relative to its own historical range. Fourth, weight them – a common starting point is 30% survey, 20% NPS and 50% behavior, since behavior is hardest to fake. Finally, review the weights after two quarters and adjust if one input consistently drives the score without matching real business outcomes.
Keep the inputs visible alongside the composite. A board can see a single number, but the reputation team needs to know which input moved. Our guide on translating reputation scores into board-level reports covers how to present this without oversimplifying.
A Realistic Scenario: Stable NPS, Falling Trust
A subscription software company reports NPS at +42 for three straight quarters. Leadership is satisfied. Meanwhile, annual renewals drop from 88% to 81%, and branded searches containing “cancel” and “refund” double in Search Console.
The cause turns out to be survey timing. NPS was only sent after support tickets closed successfully, so the sample was skewed toward happy customers. A price increase communicated with two weeks’ notice had damaged trust among silent customers who never contacted support. Behavior data caught it. NPS did not.
Common Mistakes in Measuring Brand Trust
The first mistake is surveying only at positive moments – after a purchase, after a resolved ticket. This inflates every score. Send at least part of your surveys on a random schedule.
The second is treating sentiment scores from social listening as a trust measure. Automated sentiment tools misread sarcasm and industry jargon, and the error rate rises in non-English markets. The article on sentiment analysis limitations explains where these numbers mislead.
The third is measuring trust only after a crisis. Without a pre-incident baseline, you cannot tell how much damage occurred or when recovery is complete. Start tracking before you need it.
FAQ
How often should brand trust be measured?
Run trust surveys quarterly and NPS monthly or quarterly depending on volume. Behavior metrics like renewal rates, abandonment and branded search should be monitored continuously, as they give the earliest warning.
Is NPS enough to measure brand trust?
No. NPS measures willingness to recommend, which overlaps with trust but misses honesty, fairness and data-handling concerns. Combine it with direct trust questions and behavioral data.
What sample size do trust surveys need?
Aim for at least 300-400 responses per segment for stable quarter-over-quarter comparison. Smaller B2B customer bases should track individual account trends instead of relying on aggregate scores.
Putting Trust Numbers to Work
Quantifying brand trust works when you treat it as a system rather than a single score. Surveys tell you what customers believe, NPS shows advocacy, and behavior shows whether trust survives contact with a checkout page or a renewal invoice. Start with a baseline, keep survey wording fixed, and weight behavior heavily. For deciding which inputs deserve a place on your dashboard, see reputation management metrics that actually matter – then revisit your weights every six months.